What is a good opt-in rate for a landing page?
A good opt-in rate is above Unbounce's 6.6% median conversion rate. 11.4% or more is the top quarter. Split yours by source, then check the next step.
Funnels5 min read
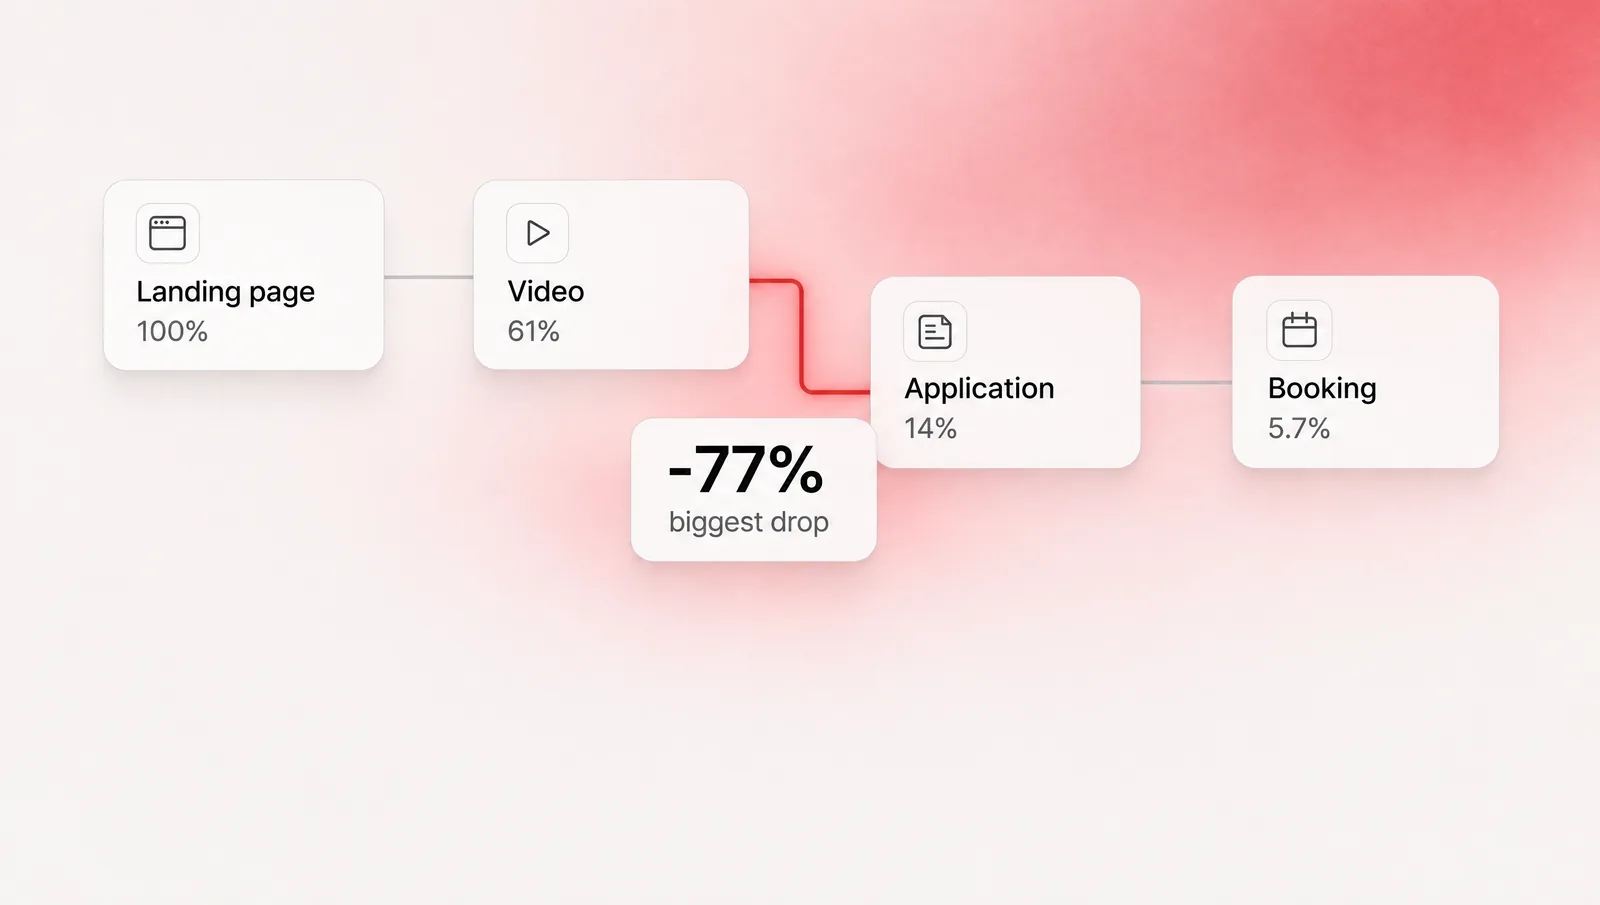
By the Morev team. The numbers in the picture are example data.
A good opt-in rate for a landing page is above 6.6%, the median landing page conversion rate in Unbounce's 2024 report, and 11.4% or more puts a page in its top quarter. Unbounce counts any conversion, not only opt-ins. Split your own rate by traffic source, then check who takes the next step.
What is a good opt-in rate for a landing page?
A good opt-in rate is above 6.6%, the median landing page conversion rate in Unbounce's 2024 report, and 11.4% or more puts a page in the top quarter. Unbounce's article on a good conversion rate, updated July 25, 2025, reports those conversion rates. Unbounce counts any landing page conversion, not only opt-ins. The high end of that top quarter is 40.8%, depending on the industry.
An opt-in rate is the share of unique visitors to a landing page who submit their details on that page. For an average landing page opt-in rate, compare yours with Unbounce's 6.6% median conversion rate. The figures come from the 2024 Conversion Benchmark Report: 57 million conversions, 41,000 landing pages and 464 million page views.
In Unbounce's 2024 report, SaaS has a 3.8% median conversion rate, and the top 25% of SaaS pages reach 11.6% or above. Professional and commercial services have a 6.1% median, and the top 25% reach 14.1% or above.
| Unbounce benchmark | Conversion rate |
|---|---|
| Median, all industries | 6.6% |
| Top quarter | 11.4% or more |
| High end of the top quarter, by industry | 40.8% |
| SaaS, median | 3.8% |
| SaaS, top 25% | 11.6% or above |
| Professional and commercial services, median | 6.1% |
| Professional and commercial services, top 25% | 14.1% or above |
Education has an 8.4% median in Unbounce's 2024 report, and online course pages have an 18.3% median. Entertainment sweepstakes pages have a 47.5% median, and Unbounce's article says the action there can be entering an email, which is easier than a purchase or a multi-field form. A good opt-in conversion rate is higher on a page that only asks for an email.
How do you calculate your opt-in rate?
Divide the opt-ins on a page by the unique visitors who loaded that page, then multiply by 100. That is the opt-in rate formula.
- Count the people who submitted the form on that page. Those are the opt-ins.
- Count the unique visitors who loaded that same page. A person who comes back still counts once.
- Divide the opt-ins by the visitors.
- Multiply by 100.
Here is an example with made-up numbers. They are not a client result. 40 opt-ins from 1,000 visitors is 4%.
Why does your opt-in rate change by traffic source?
Your opt-in rate changes by traffic source because someone who opens an email already knows you, and someone who taps a paid ad may be seeing the page for the first time.
In professional and commercial services, Unbounce's 2024 report (updated July 25, 2025) found that email traffic converts at almost 14%, while paid social traffic converts at 4.4%. In education, the same report shows email traffic at 14.1% and paid search at 7.3%. Unbounce counts any landing page conversion, not only opt-ins.
The same report says mobile is 83% of landing page visits and often converts worse than desktop. Split your opt-in rate by device as well as by source.
Here is an example with made-up numbers. They are not a client result.
| Traffic source | Unique visitors | Opt-ins | Opt-in rate | Calls booked |
|---|---|---|---|---|
| Meta ads | 1,000 | 40 | 4% | 20 |
| Email list | 200 | 40 | 20% | 8 |
| Organic | 500 | 50 | 10% | 15 |
Email has a 20% opt-in rate: 40 opt-ins from 200 visitors, and 8 calls booked. Meta ads have a 4% opt-in rate: 40 opt-ins from 1,000 visitors, and 20 calls booked. Organic has a 10% opt-in rate: 50 opt-ins from 500 visitors, and 15 calls booked. Email has the highest opt-in rate and the fewest calls. Meta books 20 calls from the same 40 opt-ins.
Should you divide by clicks or by page visitors?
Divide by the unique visitors who loaded the page. A click is counted when someone taps the ad, and some of those people never finish loading.
Opt-ins divided by clicks come out lower than opt-ins divided by people who saw the page, because the clicks include taps that never arrived. Take the visitor count from the page, or from analytics for that URL.
When the click count is higher than the number of people who loaded the page, check how fast the page loads on phones before you rewrite the offer. People who never reached the page never saw the form.
How many visitors do you need before you trust the rate?
Trust the opt-in rate once a few extra opt-ins barely change the percentage. Read each traffic source on its own.
Here is an example with made-up numbers. They are not a client result. An email source with 40 opt-ins and 200 visitors is at 20%, and 10 more opt-ins move it to 25% (50 out of 200), a change of 5 percentage points. A Meta ads source with 40 opt-ins and 1,000 visitors is at 4%, and the same 10 opt-ins move it to 5% (50 out of 1,000), a change of 1 percentage point. If 10 more opt-ins would move a source's rate by 5 points, wait for more visitors before you change the page.
What should you check after the opt-in?
Check how many of the opt-ins watch the video or book a call. A high opt-in rate can still book fewer calls.
In the made-up example above, the email list had the highest opt-in rate and booked the fewest calls.
Map each step after the opt-in and find the step that loses the largest share of the people who reached it. How to find where your sales funnel leaks shows how to count each step.
Can you track this without spreadsheets?
Yes. Morev tracks clicks, scrolls, video, opt-ins, bookings and traffic source from one script tag. Opt-ins and sales are tracked on your pages on every plan. On Pro and up, the fixes come ranked, so you know where to start. You can get a free funnel audit, or try the live demo with example data.